Learn how to adopt the practice of ITOA and apply it in your organization. Visit ExtraHop.com to get the NEW State of ITOA eBook!
IT Operations Analytics is a practice that involves collecting information technology (IT) data from different sources, examining the data in a larger context, and proactively identifying issues that could happen. With ITOA, you can begin to observe understandable patterns in large complex sets of data. The outcome of ITOA directly impacts business objectives. You can see issues as they happen, and predict potential problems.
As an example, let's look at a marching band.

The System
Together, a marching band represents an entire system: you have woodwinds, brass and percussion, to name a few sections.
Within each macro unit are micro ones: trumpets and trombones in the brass section and saxophones and flutes in another.
A company's IT environment is much the same: complex layers and different macro and micro units interacting with one another.
Interested in seeing what people think about ITOA?
Download The State of ITOA Today ebook to see the survey results.
Working Together
With all of these pieces in motion, is there something that can look at everything at a high level and make sense of the complexity?
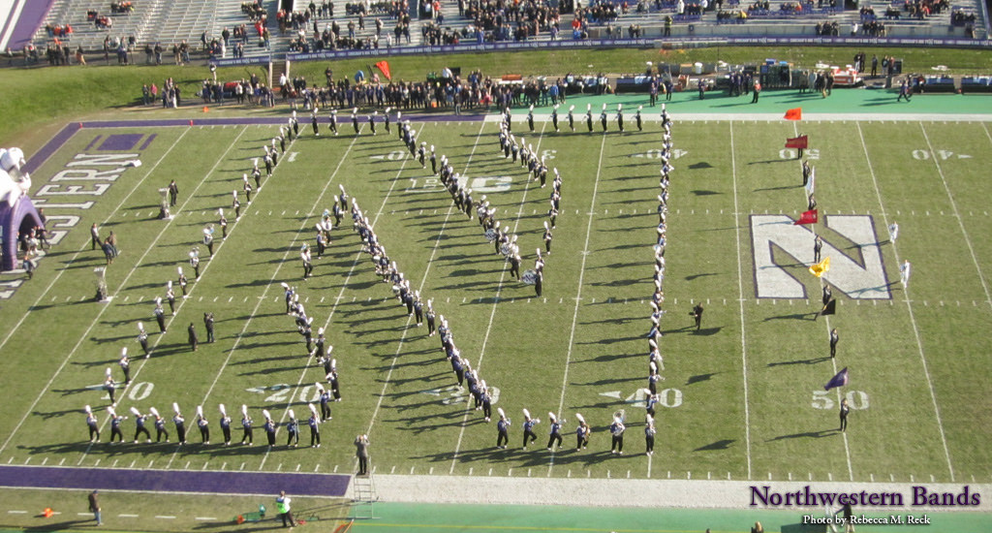
An IT operations analytics approach or the practice of ITOA allows you to gain greater visibility into the performance of your applications and infrastructure, to get richer insights into what's happening in your environment, so you can make smarter, well-informed decisions. This is not unlike a drum major, who has that overall view of the marching band, and is able to view opportunities for the band to be more cohesive. With key insight that ITOA brings to the table, one company realized that what started as a back-end IT tool is helping turn their IT department into a profit center.
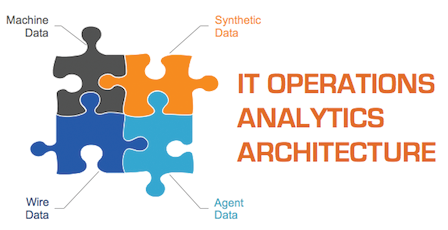
The Types of Data ITOA Collects
There are four primary sources of data from your applications and infrastructure that can provide intelligence and insight. Typically: you need a smorgasbord of IT tools in order to gain the visibility needed to see all of the pieces. The following is each of the sources of data:
![]()
Agent: includes all instrumented and observed behavior by a software agent residing on the host. This can be either on bare metal, in an application, the O/S, or hypervisor. This data includes system resource usage, host-based ingress and egress transaction data. Also included is code-level stack trace inputs.
![]()
Machine: includes all event logs, CDR, CMR, SMNP, WMI information, etc. Basically: anything that a machine records about its own activity. Think of this data source as system self-reported information.
![]()
Probe: includes synthetic transactions and service checks. This data source enables IT teams to test common transactions from locations around the globe or within the datacenter. It's scripted, periodic transaction behavior information.
![]()
Wire: includes the real-time stream analysis of any wire protocol that transacts across a network or networks. Any application communication between applications, clients, machines, sensors or system is this information source. Essentially: this information is every observed transaction.
Bring It Together
Once all of these data sources are working together, you can have a holistic view of what's happening in an IT environment - similar to an IT drum major. You'll be able to recognize gaps or issues as they happen. And correct it quickly.
Learn more about IT Operations Analytics
To see how an IT operations analytics platform looks, you can interact with an actual dashboard at ExtraHop.com.
To learn more about ITOA, we recommend the following articles:
- The four data sets essential to ITOA
- How ITOA is delivering on the promise of DevOps
- Designing and building an open ITOA architecture
- How 'ITOA' is combating infrastructure problems before they even happen
We also recommend following these ITOA expert individuals and companies on social media: